Monitor
AEO Dashboards
Build dashboards from every screen, save them, and export them for your team.
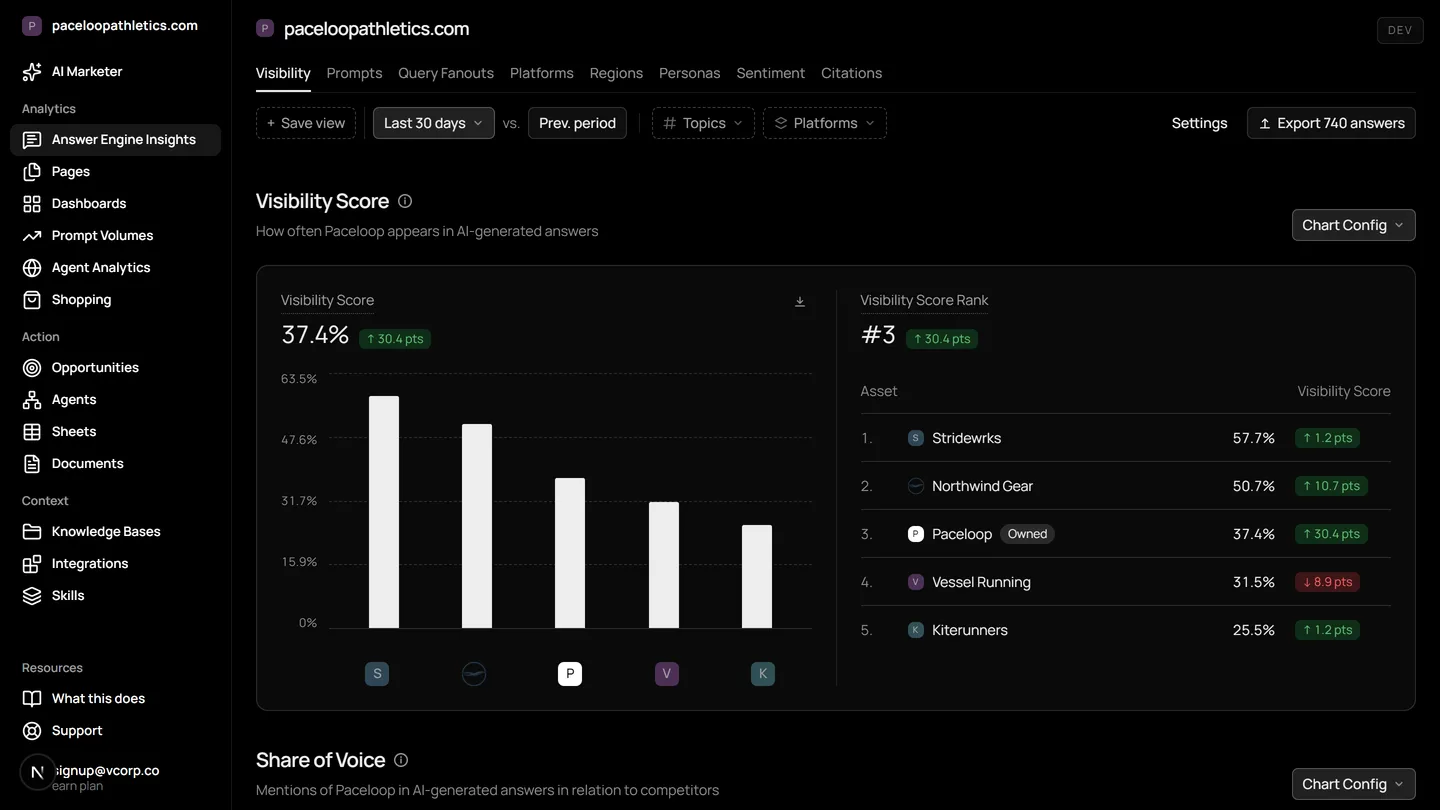
An AI visibility dashboard is a single report that shows how often your brand is named in AI answer engines like ChatGPT, Gemini, and Google AI Overviews, alongside metrics like share of voice and sentiment. Mentionry builds these dashboards from your tracked prompts, letting you arrange visibility, citations, and sentiment widgets your way and export them as a PDF for your team or clients.
Understand and control your AI presence
Widgets from every screen
Visibility, share of voice, average position, citation share, topic matrix, sentiment. Each takes the same filters as the screen it came from.
Saved layouts and exports
Several dashboards per account, each saved, each exported as PDF for your team or your client.
What is not there yet
- A public share link is not built yet. Export the PDF, or add a seat on Enterprise.
Where it lives in the platform
In the product it is /dashboard/dashboards. On the trial it reads your own site from the first day; on Starter it keeps going, and on Enterprise it runs for every brand you have under one login.
What an AI visibility dashboard is
An AI visibility dashboard is a report built for a new kind of search. Buyers now ask AI assistants what to buy, and those engines answer with a paragraph, citing a handful of sources. Your brand either appears in that answer or it does not. An AI visibility dashboard collects the metrics that matter from those interactions: how often you are named, what is said about you, which of your pages the engines read, and how you compare to the competitors the engines also mention.
This is different from a traditional SEO dashboard. There, you track rankings for thousands of keywords and the traffic they bring. Here, you track a smaller set of high intent questions and the binary, cited answers they generate. The dashboard answers one question: when our buyers ask an AI, what does it tell them about us?
Why you need a dashboard for AI search
AI search changes what you measure. A search engine result page has ten blue links, and position five can still bring visits. An AI answer engine gives one answer. If your brand is not in that answer, or if the citation is to a negative review, that is the only information the buyer receives. There is no page two.
This makes share of voice and sentiment critical. You need to see not just if you are mentioned, but what proportion of the answer you occupy compared to a rival, and whether the description is positive, neutral, or negative. An AI visibility dashboard brings these metrics together with the underlying citations, so you can see which of your own pages are being used to build those answers and which are being ignored.
How the Mentionry AI visibility dashboard works
You write the questions your buyers ask into Mentionry. Each question, or prompt, is put to the answer engines on your plan once a day. Mentionry records the full answer text, every URL the engine cites, every brand name it includes, and the sentiment.
From those daily readings, the platform calculates metrics: a visibility score (how often you are named), your share of voice against named competitors, your average position within answers, sentiment, and a breakdown of citations into your owned domains, your operated profiles, and earned mentions from other sites.
The AEO Dashboards screen lets you build reports from these metrics. You add widgets from any other screen: a visibility trend graph, a share of voice pie chart, a citation breakdown table, a sentiment gauge, or a topic matrix. Each widget inherits the filters you can apply on its source screen, so you can create a dashboard for a specific product line, a particular region, or a key competitor set.
How to use it in your week
A typical workflow starts with a client dashboard. You might create a saved dashboard called 'Q2 Client Report'. Add a visibility score widget filtered to the last quarter, a share of voice widget comparing your brand to three key rivals, and a citation breakdown widget showing how many citations came from your blog versus industry news. Before a meeting, you export this dashboard as a PDF to share.
For internal review, you could have a dashboard for product launch monitoring. Open the dashboards screen and create a new layout. Add a sentiment tracking widget filtered to the new product name, and a topic matrix widget to see which features the engines are associating with it. Check this each morning to catch any negative narratives early.
To diagnose a visibility drop, build a diagnostic dashboard. Start with a visibility trend line showing a decline. Add a citations widget for the same period, filtered to 'earned only'. Look for a drop in citations from key industry sites. Then, use the Pages screen to see if those sites are still being opened by the AI crawlers, or if they have been replaced by other sources.
How to read the numbers
A rising visibility score means the engines are naming your brand more often in answers to your tracked prompts. This is good, but check the sentiment widget to ensure the descriptions are positive or neutral. A high share of voice is only valuable if the associated sentiment is also high.
A change in average position is less granular than in traditional SEO. Moving from 'mentioned in paragraph three' to 'mentioned in paragraph one' is a positive shift, but the engine may rewrite the answer entirely the next day. Watch the trend, not the daily snapshot.
The citation breakdown shows your reliance on different sources. A high proportion of owned citations means the engines are mostly reading your own content. A high proportion of earned citations means third parties are vouching for you. A sudden shift from earned to owned might indicate that industry coverage has slowed, and the engines are falling back on your own material.
What the dashboard does not do yet
You cannot generate a public, view only link to a dashboard. To share with someone outside your account, you export the dashboard as a PDF. For ongoing client access, you would add them as a seat on an Enterprise plan.
The dashboard is built from your own tracked prompts. It cannot show you the prompts other companies are tracking, or aggregate industry wide data. The Prompt Volumes feature, which estimates search demand, is marked partly live as it uses estimated search data, not a panel of actual assistant users.
The dashboard does not proactively alert you to changes. If you want a notification when sentiment drops or a competitor's share of voice spikes, you build a scheduled agent to check those metrics and send a message to your Slack or email.
Plans and access
The AEO Dashboards feature is live on every plan. You can try it free for seven days on the trial, which lets you track 50 prompts a day against ChatGPT, Gemini, and Google AI Overviews.
The Starter plan, at $99 a month, includes the dashboards with 50 tracked prompts, readings on those three engines, one brand, and 100 agent runs a month.
Enterprise plans are quoted for multiple brands, higher prompt limits, and access to more engines like Claude and Perplexity. They include more seats, API access, and SSO for team management.
Questions
As a PDF today. A live public link is on the list.
Get your brand mentioned by the answer engines
Reach millions of consumers who are using AI to discover new products and brands. The first 7 days are free and take no card; Starter is $99 a month after that, and Enterprise is tailored.